Automated Security Reporting
Having some form of automated security reporting platform will help organisations to have real-time visibility of the security posture across their environment. By tailoring the dashboards to different audiences (or personas), CISOs and CIOs can leverage data for decision-making, giving visibility to all levels within the organisation.
Where do we start?
Are you interested in building the full-blown solution, that caters to all use cases, or are you happy to take it step-by-step, and build it out as needed? In many cases, it will come down to priority, budget, and resourcing.
What is important?
Some things are more important than others. When measuring security posture across your organisation, it is important to take a holistic approach, with a range of measures that contribute to various control objectives.
Types of measures
| Type | Description | Examples |
|---|---|---|
| Foundational | Responsible for measuring the effectiveness of the infrastructure itself. | Servers with uptime higher than 98% |
| Coverage | Responsible for measuring how well a particular control is deployed across an environment | Servers with anti-virus deployed |
| Posture | Responsible for measuring how effective a particular control is operating | Servers with a successful backup in the last 24 hours |
Note
Have a look at the Metric Library for some inspiration to which metrics would work within your environment.
Think of the math
When measuring several controls, keep things simple by measuring everything as a percentage (with 100% being the best). This allows for easy aggregation of the measures.
- What does success look like? A target (or SLO) should be defined to determine when the measure would be considered achieved.
- How much does the measure contribute to the total score? A weight can be applied to each score and used as a weighted average.
Design
Who will use it (and why)?
- Executive - the high-level aggregated view over time, grouped by metric category
- Management - the overall trend over time, with a view of all the metrics
- Operational - the detailed view showing the specific metric, and the objects that are not compliant.
Choose your tooling
A number of tools will be required to build your ASR. The main components you will need are :
- Data warehouse - a platform where all the data can be stored, and where processing can occur. postgres works quite well and can be spun up on AWS, Azure or GCP.
- Collector - a process or solution responsible for connecting to the data sources to extract the data required. For example Steampipe or CloudQuery.
- Data processing - a tool responsible for running all the SQL queries. For example dbt.
- Orchestration - a tool responsible for scheduling the data extracts, and running the data processing.
- Dashboard - some reporting platform that will allow for the creation of the visuals. For example, Metabase or Apache Superset.
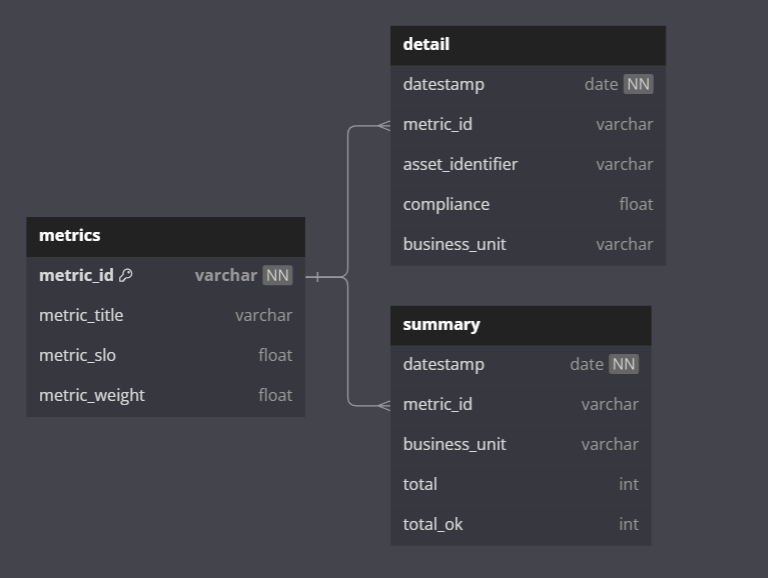
Data Model
You will need to design a data model that will cater to the ingestion of the raw data, the processing, and storage over time. Storing data in a time-series manner will allow for generating trends over time.
It helps to start at the reporting end - what reports will you be generating, and what data would you need to achieve that? Working your way back, you'll realise you'll need a summary view, that shows the measures with their scores over time. You'll also need a detailed view that will store the results of the measures, and what the compliance score of each object is.
Data considerations
Being able to slice the data from one business unit to another will help to drill down to various units, and demonstrate the data set in smaller chunks.
How it works
- The collector retrieves the raw
jsondata from the API calls and saves the data in the Data Warehouse. - A
dbtmodel is responsible for parsing thejsonblobs into usable database tables. - From these tables, different measures are generated. Filters and logic are applied.
- The business unit for each asset is determined.
- The measures are loaded into the
detailtable. - A process is run to aggregate the
detailtable into thesummarytable.
Warning
Do not create a "view" of the detail table - that defeats the purpose of utilising a table for performance reasons.
- The dashboard will consume the
summarytable to generate the aggregated scores and trend graphs.
Improve
No platform is ever perfect, and an Automated Security Reporting platform will need to grow and evolve. Once the reporting is being consumed, you will receive feedback. Measures will be challenged and scrutinized, which will lead to the overall improvement of the quality of the measures.
Other things to consider in your platform are:
- Other dimensions
- Keep track of historical changes to the metric definition
- Adding more detail to help technical teams remediate any non-compliance
- Data retention considerations, and deleting data that is no longer required.
- Add more data sources to expand the capability and coverage of the platforms
- Importing data from a CMDB or asset register to further enrich the reporting
Is that it?
While the data engineering of the platform is relatively straightforward, the challenge comes in the functional design that needs to consider the business personas, their particular needs and uses for the platform, the data sources, the metrics themselves, the compliance frameworks that need to be considered, and so on.